Available with any of the following subscriptions:
- All plans
Definition
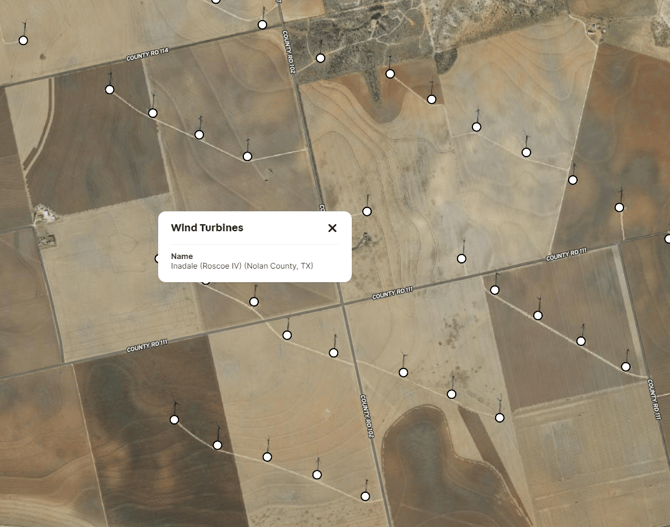
Our Wind Turbine Overlay represents known built turbines as points. When available, each turbine point will show information about the wind project it is associated with. Data is provided by the Federal Aviation Administration.
Key Benefits
-
Useful for renewable energy planning
-
Useful to buyers for visual impact assessments
Tip: Click on a wind turbine icon to see a pop-up that includes the wind farm name and county associated with each turbine.
Limitations: This overlay should be used for reference only. Users should be cautious of potential temporal lags in updates, omissions and positional precision errors.
Coverage
United States of America
Update Frequency
As updates are available
Frequently Asked Questions:
1. What are the practical differences between the Wind Farms and Wind Turbines (Permitted) overlays?
The Wind Farms layer represents the full footprint of a wind project as a red polygon, which is easier to identify at a zoomed-out level. As you zoom in, you’ll see individual turbine locations within that footprint. The Wind Turbines layer shows those individual turbine points directly. The underlying attribute information is generally the same for both (e.g., county or basic project info).
2. Does either layer include projects that are permitted or approved but not yet built, versus constructed or operational turbines ?
Both layers reflect projects that are already constructed/operational. They do not include projects that are permitted or approved but not yet built.
3. Which layer you’d recommend using if the goal is to screen for land with development potential, rather than land already encumbered by completed wind projects?
If your goal is to identify land with development potential (rather than land already encumbered), I’d recommend using the Land Use overlay. This will help you identify parcels by categories such as residential, vacant, industrial, agricultural, commercial, or exempt. Pairing this with other overlays—such as FEMA flood data, transmission lines, substations, etc.—can help further refine suitable areas based on your criteria.
4. Is there overlap between these layers that could result in double counting?
Yes, there is overlap. The Wind Farms layer shows the overall project boundary, while the Wind Turbines layer shows the individual turbines within those projects, so using both together could result in double counting if not interpreted carefully.
5. Are there other overlays with similar function or potential overlap that we should be aware of but may not have identified yet?
There aren’t additional overlays with the same function as these wind layers, but as mentioned, combining them with infrastructure and environmental overlays can provide helpful additional context.