How to Enable High-Resolution Contours
Available with any of the following subscriptions:
- Standard: All Plans
- High-Resolution:
- Land id Pro Plan
- Land id Pro Unlimited Plan
Definition
Contour lines are lines on a map that connect points of equal elevation or altitude above a specific reference point, usually sea level. These lines depict the shape and elevation of the land surface, forming a contour map. Each contour line represents a specific elevation, and the spacing between contour lines indicates the slope or steepness of the terrain.
Contour lines are fundamental in cartography and topographic mapping, providing a visual representation of the three-dimensional nature of the landscape on a two-dimensional map. They are instrumental for understanding the geography, planning routes, and assessing the relief of a given area.
We source the highest-resolution contour lines available. 2-foot High-Resolution contours are available for 92% of the Continental US and Hawaii. Standard resolution contour intervals range from 10-20 feet.
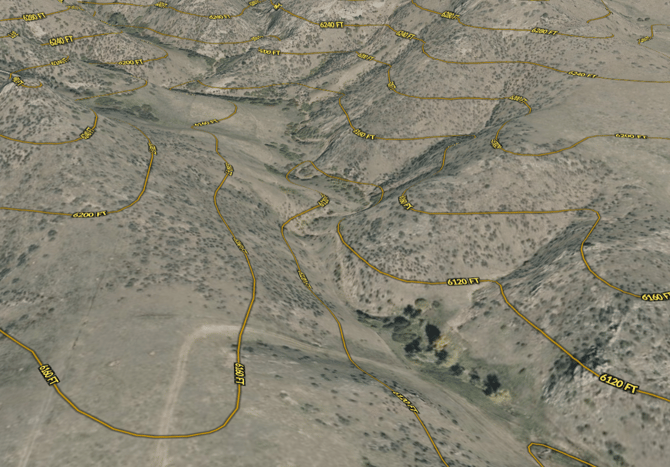
Standard Contours:
High-Resolution Contours: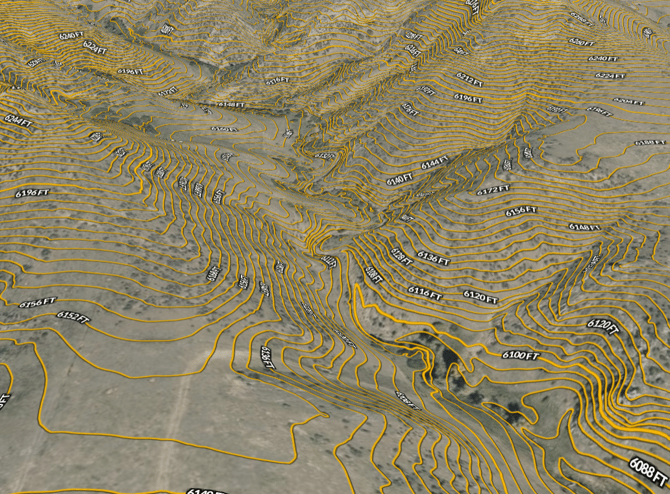
Key Benefits
- Serves as a vital tool for various applications, particularly in terrain analysis, environmental modeling and land-use planning
- Enables users to visualize and analyze the topography of a landscape, identify slopes, valleys and ridges and assess terrain characteristics such as drainage patterns and landform features
- Landowners can use this information to plan future developments like homesites, livestock management facilities, fencing and pond/tank placement.
Tip: Each contour line is labelled with its elevation in feet.
Limitations: Our contour dataset could include potential inaccuracies in elevation data, which can arise from errors in data collection methods, interpolation techniques or variations in terrain characteristics. We've made efforts to mitigate potential gaps that may arise along administrative boundaries.
How to Enable High-Resolution Contours
Coverage
United States except for Alaska
Update Frequency
As updates are available
back to top